Let’s Talk Politics: Exposure to Political Social Media Content
Lauren Blois
Social media and politics are overlapping like never before. From news networks using social media to distribute stories to presidential candidates using the platforms to reach voters, there has been a noticeable shift in what may appear on a user’s feed: political content. Where many young people use social media and may be exposed to political content, I posed the following research question: What is the effect of exposure to political social media content on users’ engagement in political conversations?
The common wisdom is that social media echo chambers are making young people less willing to engage in conversations about politics. This research is important because by examining college students’ exposure to political social media content, we can gain a better understanding of their engagement in political conversations on campus and the potential contributing factors to such engagement. Participation in political conversations is central to democratic discourse, so it is vital to understand in order to maintain a healthy democracy.
I hypothesized that the more content a user sees that affirms their political views, the less likely they are to have engaged in in-person political conversations. Similarly, I assumed that the more unaffirming content a user sees, the more likely they are to have engaged in in-person political conversations. Moreover, I hypothesized that there is a difference in a user’s willingness to engage in a political conversation depending on their exposure to affirming and unaffirming content, respectively. Additionally, I expected to find such users vary in their willingness to engage in a political conversation with someone when the conversation is specified to be either in-person or online and depending on the other individual’s political ideology. While my hypotheses may seem obvious, they serve as a test of what many people believe to be true: young people are not willing to have face-to-face conversations due to their social media use.
I surveyed 287 Saint Anselm College students about their political ideology, voting practices, exposure to political social media content, and their general engagement and willingness to engage in political conversations. My analysis showed that the more affirming content users see, the more likely they are to have engaged in in-person political conversations. Additionally, I found the more unaffirming content a user sees, the more likely they are to have engaged in in-person political conversations. Moreover, I found as exposure to affirming content increases, users are more likely to be willing to engage in an in-person political conversation with another Saint Anselm student with whom they share a similar political ideology, and as exposure to unaffirming content increases, users are not more willing to have an in-person conversation with someone who has a different political ideology. Overall, young people are more likely to engage in political conversations with those who have a similar political ideology, regardless of their exposure to affirming or unaffirming content on social media.
Literature Review
In America, the scope of social media is widespread and plays a crucial role in understanding political polarization. The term “social media,” defined as means of electronic communication through which users foster online communities to share content with an audience, is generally used interchangeably with “social networking sites,” which are platforms that are more focused on building communities, rather than building an audience (Encyclopedia Britannica, s.v. “Social Media,” accessed March 11, 2025, https://www.britannica.com/topic/social-media). Even though political polarization has not been consistently defined, there has been an increase within the last decade in research that examines the role of media, including social media, in forming political polarization (Kubin and von Sikorski 2021, 197). While most research has found a relationship between social media and polarization, only some have examined the impact of social media’s algorithmic effects on users, and even fewer have explored the relationship of exposure to political content on social media and users’ engagement in political conversations (Van Bavel et al. 2021, 913-14).
By political social media content, I mean any posts on social media that relate to a political figure, posts regarding a political topic in a manner of expression or debate, or comments under such posts about a political figure or issue. Social media algorithms are a complex set of calculations and rules that aim to prioritize the content that appears in users’ feeds (Sharma 2024). The impact of these algorithms can affect users’ perception of political issues or figures, as they are likely to create echo chambers. An echo chamber is an environment in which a user’s opinion, belief, or political leaning about a topic is reinforced by consistent interactions with sources or peers with similar views (Cho et al. 2020, 168; Cinelli et al. 2020, 1). I believe that these echo chambers exacerbate, if not create, a politically polarized communication climate. Furthermore, researchers have proven a direct, negative relationship between social networking sites (SNS) and users’ willingness to discuss a political issue offline (Hampton, Shin, and Lu 2017, 1098). Across the literature about the relationship between social media and political polarization, there are three main themes: algorithms and echo chambers, polarization, and communication. By examining each theme, aspects of social media use, such as algorithms and their allowance of exposure to political content, can provide insights into users’ communication habits and willingness to have conversations about politics.
Social media algorithms personalize a user’s feed by tracking the content with which the user interacts. Some studies have shown that algorithms may create echo chambers where opinion-reinforcing environments are created (Kitchens et al. 2020, 1619). For example, a TikTok user’s feed could be filled with videos favoring a preferred political candidate rather than an unfavorable one because of the algorithm’s ability to track the users’ interactions with similar posts and produce content that reaffirms the user’s opinions. While the existence of algorithms may be known, scholars have proven that being aware of social media algorithms in one situation does not always make users aware of them in other contexts (Swart 2021, 8). This lack of awareness may alter how people discuss politics online and offline. Social media algorithms and the echo chambers they create transform political conversations and may lead to political polarization.
Some scholars argue that there are two kinds of political polarization: ideological and affective. Ideological polarization is “the divergence of political opinions, beliefs, attitudes, and stances of political adversaries,” whereas affective polarization is the extent to which an individual likes their political allies and dislikes their political opponents (Kubin and von Sikorski 2021, 188). Exposure to counter-attitudinal news on social media, or news that does not match an individual’s ideology, has been found to decrease affective polarization (Levy 2021, 832). Thus, it can be theorized that exposure to pro-attitudinal news on social media platforms may increase affective polarization; likely because users are in an echo chamber. However, some scholars state an attempt to expose social media users to opposing political views may be counterproductive (Bail et al. 2018, 9220). A polarized climate, instigated by echo chambers, can have an impact on users’ willingness to have conversations about politics.
While much social media content can be political, people hold various motivations and goals for their social media use and their political conversations in general (Astleitner and Schlick 2025, 240; Barnidge 2017, 312; Yamamoto, Kushin, and Dalisay 2015, 881; Zúñiga et al. 2016, 533). This could be a cause of civil discourse lacking on social media (Kruse et al. 2018, 76). The shortfall of such discussion may also result from users being confined to echo chambers because if exposed to content that does not reinforce their preexisting beliefs, they may be less likely to have civil conversations. Some political discourse even results from satirical content about politics, which can promote discussion about the content itself and advance political discourse (Jeong, Long, and Lavis 2023, 954). Many young social media users are exposed to political conflict online. Those who are most involved in online political discussions are more likely to encounter such conflict (Middaugh, Bowyer, and Kahne 2017, 902).
Across the literature on political discussions, self-censorship is a recurring theme. Self-censorship is the withholding of one’s opinion around an audience perceived to disagree with that opinion (Hayes, Glynn, and Shanahan 2005, 443). Moreover, scholars argue “in a polarized, hostile political climate, some people decide not to participate in public forms of opinion expression because there may be negative social ramifications of doing so” (Hayes, Sheufele, and Guge 2006, 263-264). I believe that individuals’ desire to self-censor is indicative of a politically polarized climate, which is likely reinforced by echo chambers on social media. Not all political discussions influenced by social media happen online – they can also occur in offline contexts. One study found that individuals felt there were fewer negative repercussions of offline political expression (Powers, Koliska, and Guha 2019, 3644). Those who avoided political conversations offline did so out of fear of backlash in professional settings, such as the workplace, or to maintain relationships (Lorenzano et. al 2018, 9). Another study shows that in the workplace, people are more likely to partake in discussions about politics with those with whom they share an opinion (Hampton, Shin, and Lu 2017, 1098).
There is a gap in the research on this topic about current college-aged students and how echo chambers may influence their exposure to political social media content in a few ways. These factors could be how exposure to political content on social media may impact their general habits or willingness when it comes to having political conversations with people who have similar or different political ideologies, both online and offline. While some scholars have found patterns about certain platforms promoting political discussion, there is limited research on how in-person or online political discussions among college students develop (Platt et al. 2024, 2272; Ponder and Haridakis 2015, 297). Many scholars have also found that some social media users have “accidental” exposure to unaffirming content, but it is likely that the number of these situations are decreasing due to the nature of algorithms (Kwak et al. 2022, 580). Thus, much of the research on this topic is outdated given the constant evolution of social media.
It is essential to understand this plausible relationship, as current college students and the rest of Generation Z will make up about half of the electorate, along with millennials, in 2028 (Smith 2023). Understanding this relationship is crucial because, with evidence of social media algorithms and echo chambers impacting users’ willingness to converse about politics, political polarization may be reduced through awareness and systematic changes in the social media apps themselves, such as increasing exposure to unaffirming political content. In the last few years, there has been much research about the effects of social media on democracy (Persily and Tucker 2020, 1; Yarchi et al. 2021, 99). I believe democracy could suffer from the effects of political polarization. Therefore, research on this topic is imperative to gain a better understanding of the future of politics and communication habits.
Research Question
My research question is: What is the effect of exposure to political social media content on users’ engagement in political conversations? Answering this question will fill a gap in the research on how young people’s social media use affects engagement in political conversations. I tested this population by surveying Saint Anselm College students. This research question is essential in gaining a better understanding of the ways in which social media users interact with one another, both in-person and online.
Hypotheses
I theorized that social media algorithms contribute to echo chambers, making users more or less likely to engage in political conversations. The more affirming content someone sees, the less likely they are to want to talk about politics, particularly in person, where they cannot hide behind a screen. Therefore, people will avoid engaging in an in-person political conversation. Similarly, users who are exposed to content that does not affirm their political views are more likely to engage in in-person political conversations because they are aware of other viewpoints about a political topic, figure, or issue. So, they would not avoid an in-person conversation because they are familiar with hearing unaffirming things, which could come up in an in-person conversation, where they cannot be shielded by a screen.
As research shows that in the workplace, people are more likely to partake in discussions about politics with those with whom they share an opinion, I hypothesized the same to be true on college campuses (Hampton, Shin, and Lu 2017, 1098). I theorized users who see affirming content are more likely to gravitate towards those who reinforce their political views. Thus, they would likely be more willing to engage in a political conversation with someone with whom they share a similar ideology because they are not used to being exposed to unaffirming viewpoints. Likewise, I theorized that those who see unaffirming content are more willing to discuss politics with someone who has a different political ideology because they are familiar with hearing differing political viewpoints. Therefore, these users would not shy away from having a political conversation with someone with whom they do not share a similar political ideology. Based on my theories and competing schools of thought, I developed four hypotheses that I believed could support my research question.
H1 – As exposure to affirming content increases, users are less likely to have engaged in in-person political conversations.
H2 – As exposure to unaffirming content increases, users are more likely to have engaged in in-person political conversations.
H3 – As exposure to affirming content increases, users are more likely to be willing to engage in an in-person political conversation with another Saint Anselm student with whom they share a similar political ideology.
H4 – As exposure to unaffirming content increases, users are more likely to be willing to engage in an in-person political conversation with another Saint Anselm student with whom they share a different political ideology.
Data, Conceptualization, and Operationalization
The independent variables in my research are exposure to political social media content, content that affirms political views (affirming content), and content that does not affirm political views (unaffirming content). These variables are measured in questions 9-12 in my survey (see Appendix A). Before a question asked about something that incorporates one of my independent variables or another term that the respondent must know the meaning of, I defined it prior to asking the question. My dependent variables are a social media user’s general engagement and willingness to engage in political conversations, which are measured in questions 13-19. I chose to ask questions that specifically identify the other person in the proposed conversation as a Saint Anselm student because it is a certain degree of familiarity that can add knowledge about how college students may or may not engage in political conversations with one another.
Questions 1-7 aimed to collect baseline information about my respondents. Question 1 asked if the respondent is at least 18 years old, as only those age 18 and above are eligible to participate in my study. If the respondent answered “no,” the respondent was automatically exited out of the survey. Similarly, question 2 asked the respondent if they use social media. If the respondent answered “no,” the program will automatically exit them because their response is not relevant to my research. The structures for questions 4 and 4a were drawn from the Pew Research Center (Nadeem 2024).
Questions 3 and 5 aimed to measure my control variables (political ideology and voting frequency) to identify if any alternative explanation, such as strong political ideology identification or level of voting frequency, has a relationship to users’ habits of engaging in political conversations, as well as users’ willingness to engage in political conversations. Voting frequency served as a test of a survey respondents’ engagement in politics (3 or above is considered engaged). I asked respondents which social media platforms they use on a regular basis (question 7) and how much time they spend on social media per day (question 8). These questions gave me an understanding of respondents’ social media use habits. Additionally, I asked respondents on a scale of 0-100 how much political content they see (question 9), as this exposure matters. Questions 10 and 11 asked the respondent how much affirming and unaffirming political content they see, respectively, because not all content on a respondent’s feed may be political, so asking both questions left room for other, non-political content to be accounted for.
Question 12 asked the respondent how often they engage in an in-person political conversation with another Saint Anselm student in order to understand how often the respondent participates in a conversation about politics with someone with whom they have a connection. Conversely, question 13 asked how often the respondent engages in this conversation scenario online. The replacement of “in-person” with “online” sought to expose a difference between how often the respondent engages in an online conversation about politics with someone with whom they have a connection versus an in-person conversation with the same type of person.
I asked question 14 to specify a situation where the respondent may agree with the other individual in the conversation and to see if they would be willing to engage. The contrast between questions 14 and 16 assisted me in identifying if the respondent’s willingness to engage in an in-person political conversation changed based upon their perceived agreeability with the other individual. Finally, I asked question 18 to draw a connection between the nature of the political conversation (in-person or online) and willingness to engage with someone with whom they have a different political ideology.
Method and Analysis
I collected my data via a voluntary survey sent to Saint Anselm College students. I recruited survey respondents by asking almost every professor at Saint Anselm College to send a link to my survey to their students in order to have a large sample. I aimed to survey at least one hundred students, and I received 287 responses. I analyzed my data using OLS regression analysis.
Data Analysis: Results and Findings
Descriptive Statistics
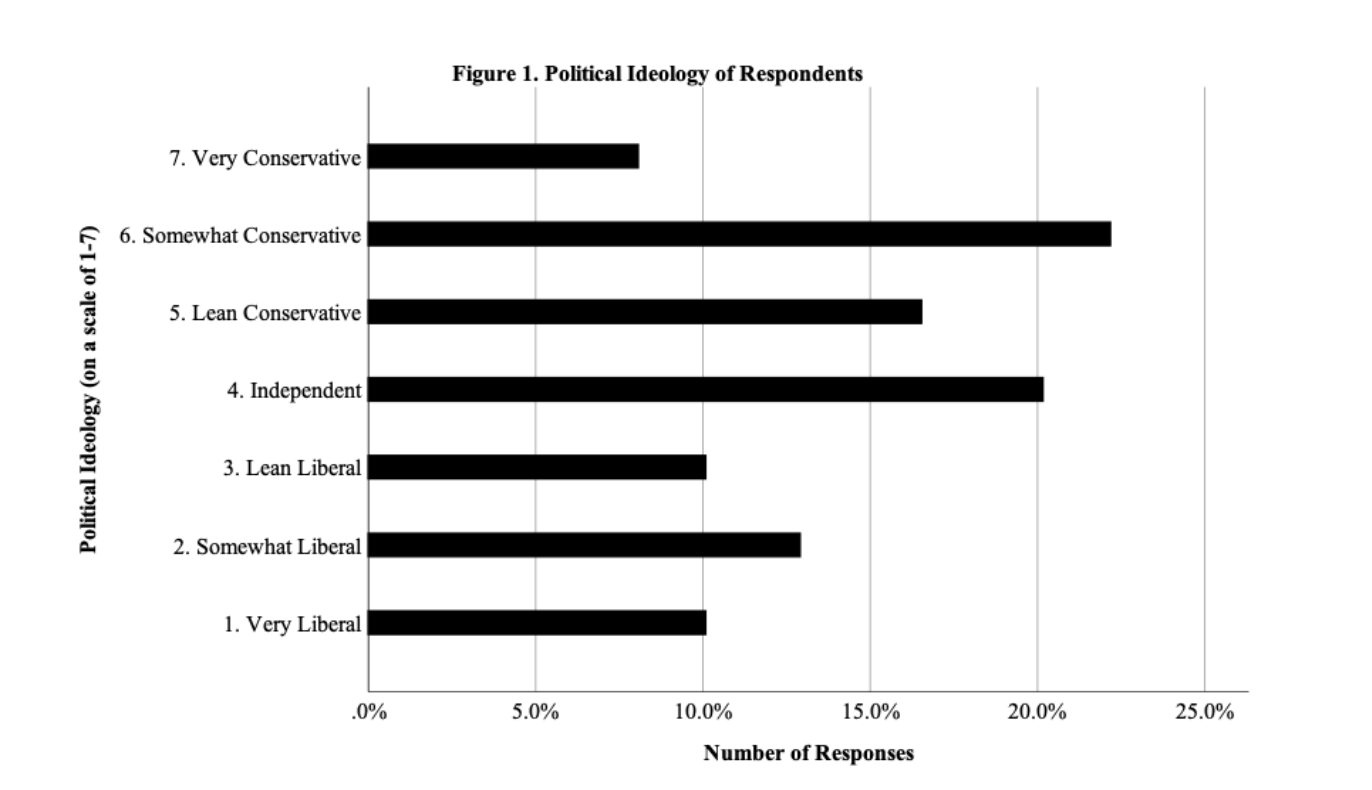
Figure 1 is a graph that shows out of 248 respondents, about 33.1% indicated that they are liberal in some way (10.1% very liberal, 12.9% somewhat liberal, 10.1% lean liberal). Moreover, 46.8% of respondents identify as a conservative in some way (8.1% very conservative, 22.2% somewhat conservative, 16.5% lean conservative). More than 20% of respondents indicated that their political ideology is independent. Overall, the median value is 4, which is “independent.”
Table 1 shows descriptive statistics for independent and control variables. Respondents reported on average that less than half of content on their social media feed is made up of political content. This provides a baseline understanding of how much political content a given user sees during their time spend on social media.
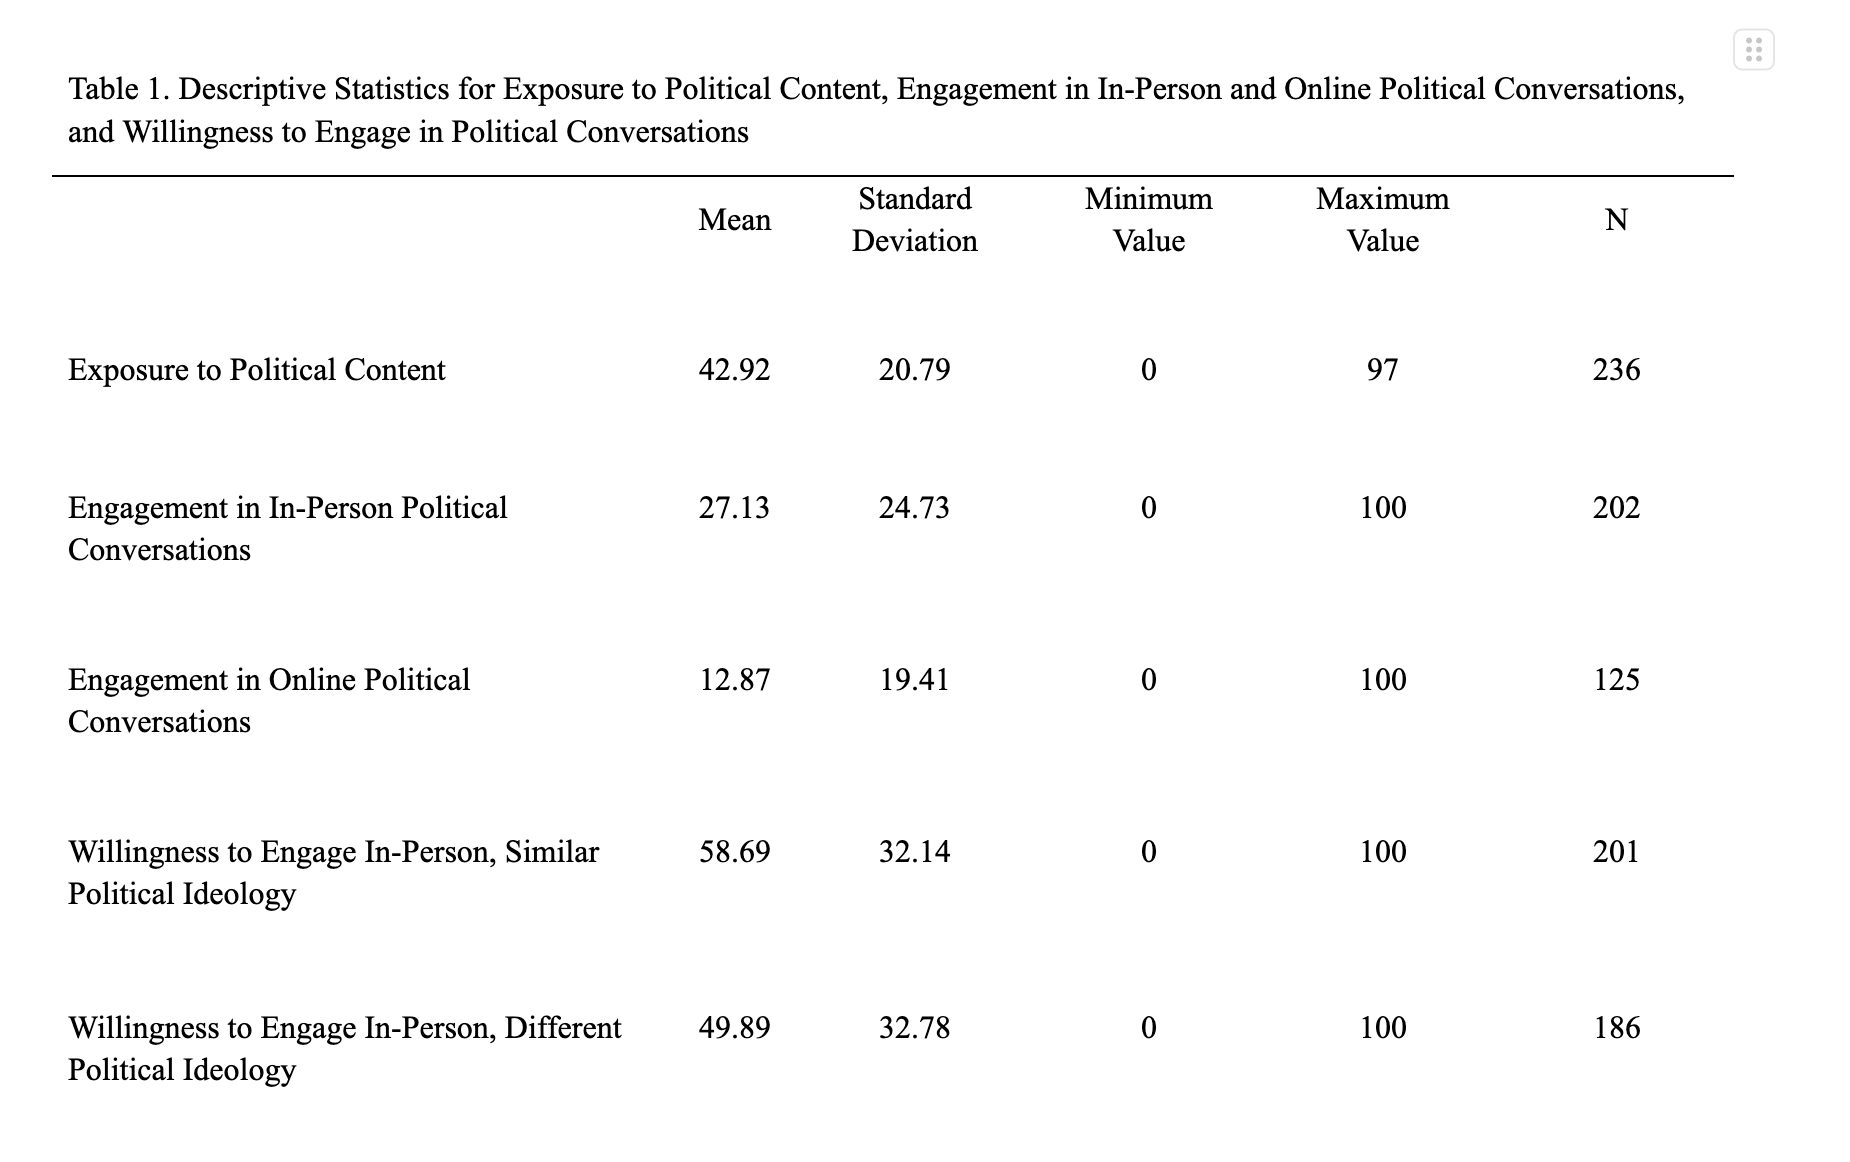
On average, respondents indicated their engagement in an in-person political conversation with another Saint Anselm student is 27.13 on a scale of 0-100. Online, however, respondents said their engagement in a political conversation is 12.87 on a scale of 0-100. Therefore, on average, survey respondents engage in an in-person conversation more than twice as often as they do online.
This could indicate a less polarized communication environment than I had predicted, given scholars argue that in a hostile political climate, some people do not participate in public forms of opinion (Hayes, Sheufele, and Guge 2006, 263-264). In other words, the higher number of in-person political conversations could reflect a non-polarized political climate, making people more likely to have in-person political conversations. Finally, overall, respondents are more willing to engage with someone with a similar political ideology than a different political ideology by about 8 points on the 0-100 scale.
Table 2 is a cross tabulation of voting frequency among liberals and conservatives. I chose these two ideologies given that they made up most respondents. Many liberals (29.6%) and conservatives (35.1%) indicated they have not yet been old enough to vote in an election. Almost 5% of liberals say they never vote, but there is about a 13% increase in the number of these respondents who rarely vote (17.3%). Similarly, 7.9% of conservatives say they never vote, and about 16.7% of them rarely vote. Just over 48% of liberals and 40.3% of conservatives are politically engaged (they vote when it is convenient, sometimes, or every time they are able to do so). Overall, liberal respondents vote most frequently, and thus, are most politically engaged.
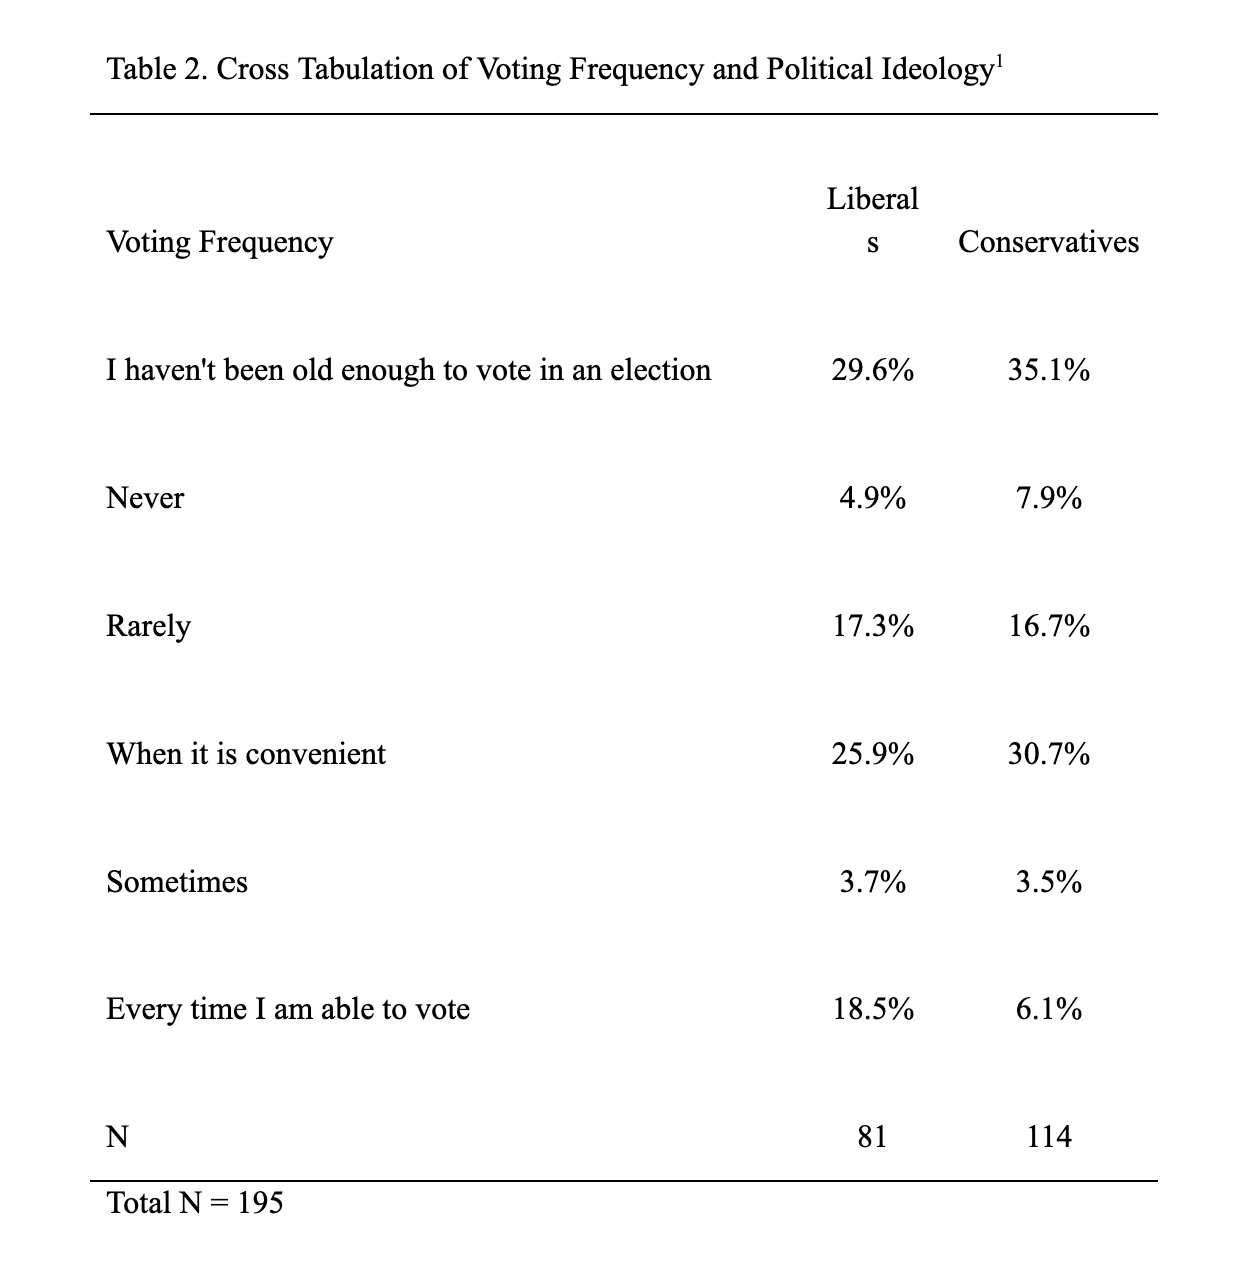
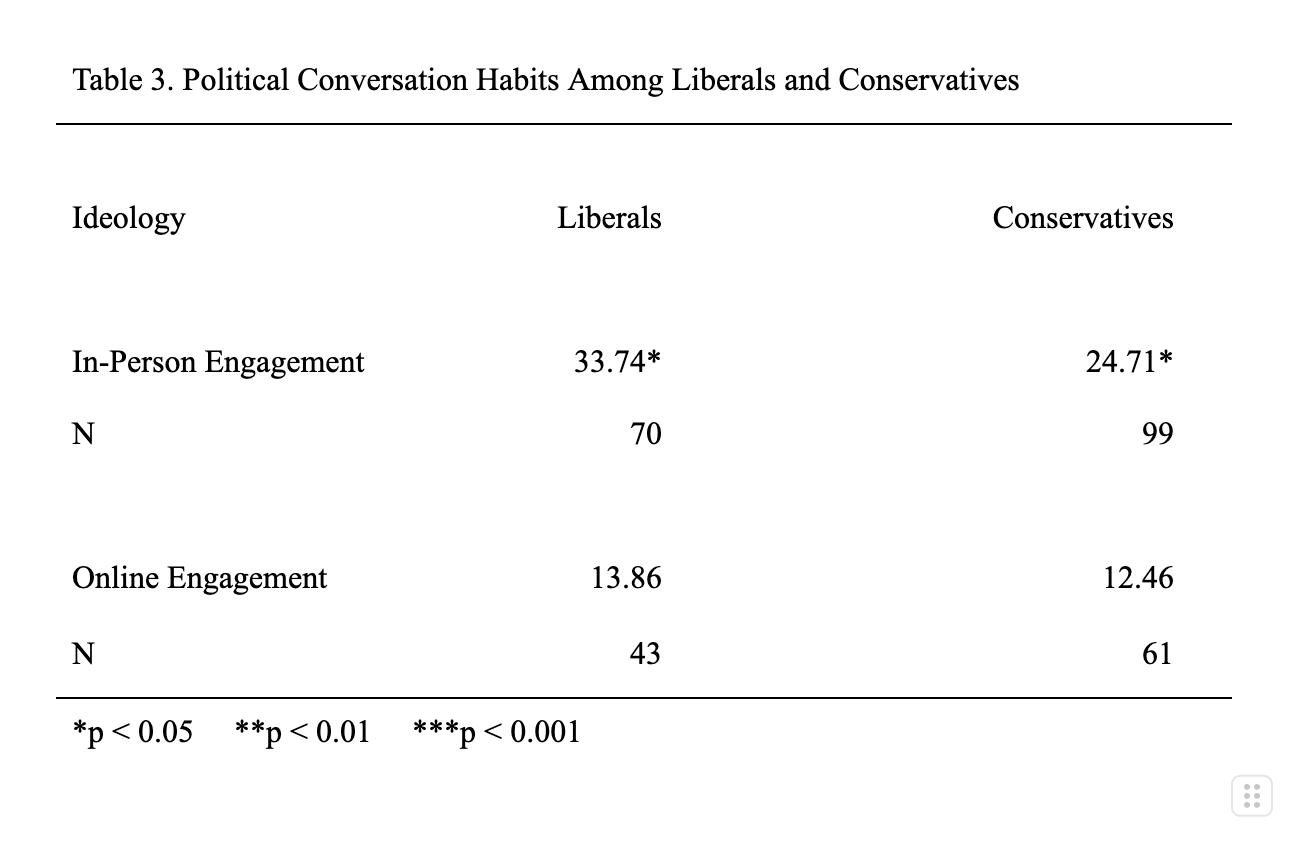
Table 3 evaluates the mean political conversation habits among liberals and conservatives. On average, liberals indicated their engagement in an in-person political conversation with another Saint Anselm student is 33.74 on a scale of 0-100, whereas conservatives engage in these political conversations less often (24.71). On one hand, liberals’ engagement in an online political conversation with another Saint Anselm student is about 13.86 on a scale of 0-100. Conservatives, on the other hand, have engaged in these conversations less often (12.46). Both means are statistically significant (p < 0.05) when it comes to in-person engagement, but not online engagement. Therefore, on average, liberal respondents are more likely than conservative respondents to have engaged in an in-person political conversation.
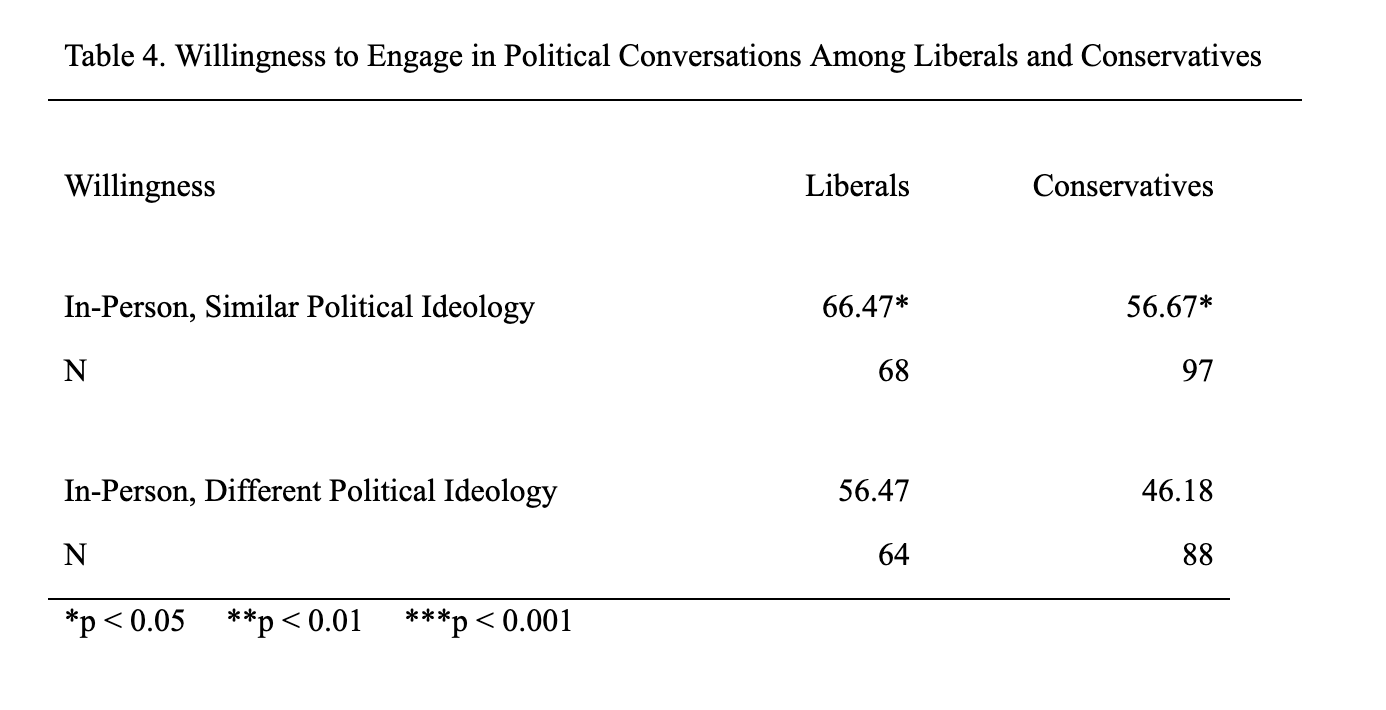
Like Table 3, Table 4 is a comparison of means between liberals’ and conservatives’ willingness to engage in in-person political conversations with someone who has a similar and different political ideology, respectively. Both means for in-person engagement with someone with a similar ideology are statistically significant (p < 0.05) among liberals and conservatives. However, this is not the case when it comes to having an in-person conversation with a different political ideology.
In addition to being the most politically engaged ideology and most likely to have engaged in an in-person political conversation, liberal respondents are also more willing to engage in such conversations with someone with a similar political ideology than conservatives.
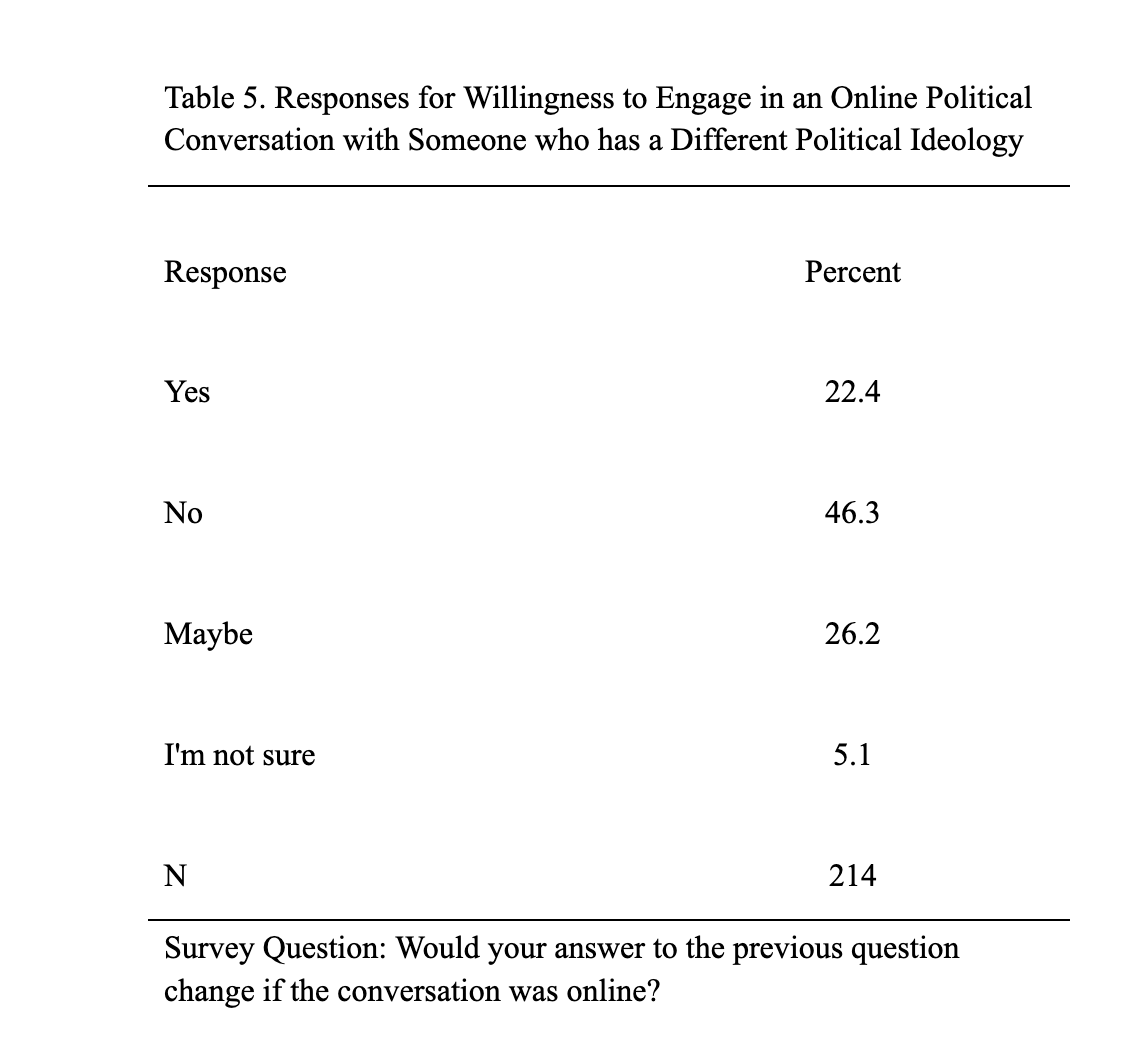
The final question in my survey tested users’ willingness to have an online political conversation with another Saint Anselm student who has a different political ideology by asking if their answer to the previous question would change if the conversation was online instead of in-person. I asked this question to better understand if knowing the context of the conversation (in-person or online) mattered, as well as the specification of the other person’s ideology.
In Table 5, out of 214 respondents, 22.4% indicated that their willingness to engage in a political conversation with someone with a different political ideology would change if it were online. Moreover, 46.3% indicated that their answer would not change. In total, 31.3% of respondents did not give a definitive answer to the question, as 26.2% answered “maybe” and 5.1% answered “I’m not sure.”
I found that most respondents’ willingness to engage in a political conversation with someone who has a different political ideology would not change if it were online. Among those who indicated that their answer would change, I identified three recurring themes in their responses: digital footprint, miscommunication/misinter-pretation, and anonymity. A digital footprint is the process of creating and storing all transactions in the digital environment (Sürmelioğlu and Seferoğlu 2019, 48). The concept of a digital footprint is one that has grown in recent years, as many people have faced social or professional repercussions, or “cancellation,” for social media posts, comments, and text messages. For example, several educators and administrators across the country were placed on leave or fired from their jobs for remarks they made on social media following the killing of political activist Charlie Kirk. During the time of racial injustice protests in 2020, many people were exposed for past racist remarks that were brought to light on social media. Many respondents indicated that their digital footprint is a reason that they may self-censor and be less willing to engage in an online political conversation. Therefore, essentially leaving behind a record of political beliefs or rhetoric is a reason that users are less willing to engage in online political conversations.
By far, most respondents were less willing to discuss politics online because it can lead to miscommunication and misinterpretation of one’s intentions. The risk of these outcomes is something that is much easier to occur in an online communication environment, as intentions can get lost easily or misread. It is difficult to read the tone of rhetoric when a conversation is held online. The lack of social cues online can make it easier to misinterpret conversations. This could have significant implications in political conversations as many topics of this nature are controversial. Moreover, many indicated that the risk of a misunderstanding could lead to conflict and dehumanization.
Additionally, a few respondents discussed the factor of anonymity, for which this study does not control. Two of these respondents said that people can be “more hateful and less empathetic” when anonymous, and it makes talking to someone with a different political ideology “more about ‘winning’ an argument than coming to a cohesive conclusion.” The ability to have a conversation anonymously is much easier online than in-person. Behind a fake name or profile photo, I assume that users are more likely to say something that they would not say in-person. They may be more hateful or critical because their name and face are not attached to their comments. Therefore, it is more difficult for an anonymous person to face repercussions for their rhetoric online. In turn, however, maybe users are more likely to engage in a political conversation for this very reason. Perhaps users are more likely to discuss politics anonymously because their digital footprint is more difficult to uncover.
Overall, respondents who would be more willing to engage in an in-person political conversation with someone with a different political ideology would do so out of avoidance of publicizing their political views and avoiding conflict. This is an example of self-censoring to stay away from potential repercussions. Respondents that indicated their willingness would not change mostly said that the context of the conversation does not matter or that they do not like to discuss politics. However, there was an overlap in discussion of digital footprints and aggression, likely among those who are more willing to talk about politics in-person.
From the descriptive statistics, I can conclude that more respondents are conservative than liberal. However, liberals vote most frequently. Furthermore, liberals are more likely to have engaged in an in-person political conversation than conservatives. Liberals are also most willing to engage in political conversations with someone who shares a similar political ideology. Finally, most respondent’s willingness would change if the political conversation was online with someone who has a different political ideology.
Regression Analysis
To test H1, I ran a bivariate regression, with exposure to affirming content as the independent variable and engagement in in-person political conversations as the dependent variable (Table 6, Model 1). The coefficient of exposure to affirming content is positive and statistically significant (p < 0.001). Therefore, for every 1-point increase on the 0-5 scale that measured exposure to affirming political content, engagement in an in-person political conversation increases by 7.85 points on the 0-100 scale measuring the dependent variable. This relationship does not affirm H1’s claim that the more affirming content a user sees, the less likely they are to have engaged in in-person political conversations. The R2 value explains that 11% of the variance in engagement in in-person political conversations is explained by exposure to affirming content.
Model 2 shows the result of this regression controlling for political ideology and voting frequency. Even with the introduction of control variables, the relationship between exposure to affirming content and engagement in in-person political conversations remains statistically significant (p < 0.001), so the null hypothesis can be rejected. The coefficient stayed positive but slightly decreased. So, for every 1-point increase on the 0-5 scale that measured exposure to affirming political content, engagement in an in-person political conversation increases by 7 points on the 0-100 scale measuring the dependent variable. Therefore, even with control variables, my findings from Model 1 are still statistically significant. Political ideology does not have a statistically significant effect on the dependent variable. Voting frequency’s effect on engagement in in-person political conversations is positive and statistically significant (p < 0.001).
Therefore, for every 1-point increase in voting frequency, engagement in an in-person political conversation increases by 3.63 points on the 0-100 scale measuring the dependent variable. The R2 value shows that 19% of the variance in engagement in in-person political conversations is explained by the independent variables. The number is higher than that in Model 1, so Model 2 explains more variation in the dependent variable. Although exposure to affirming content held statistically significant with control variables, the direction of the relationship with the dependent variable does not support H1. Rather, this analysis suggests that exposure to affirming content increases engagement in political conversations.
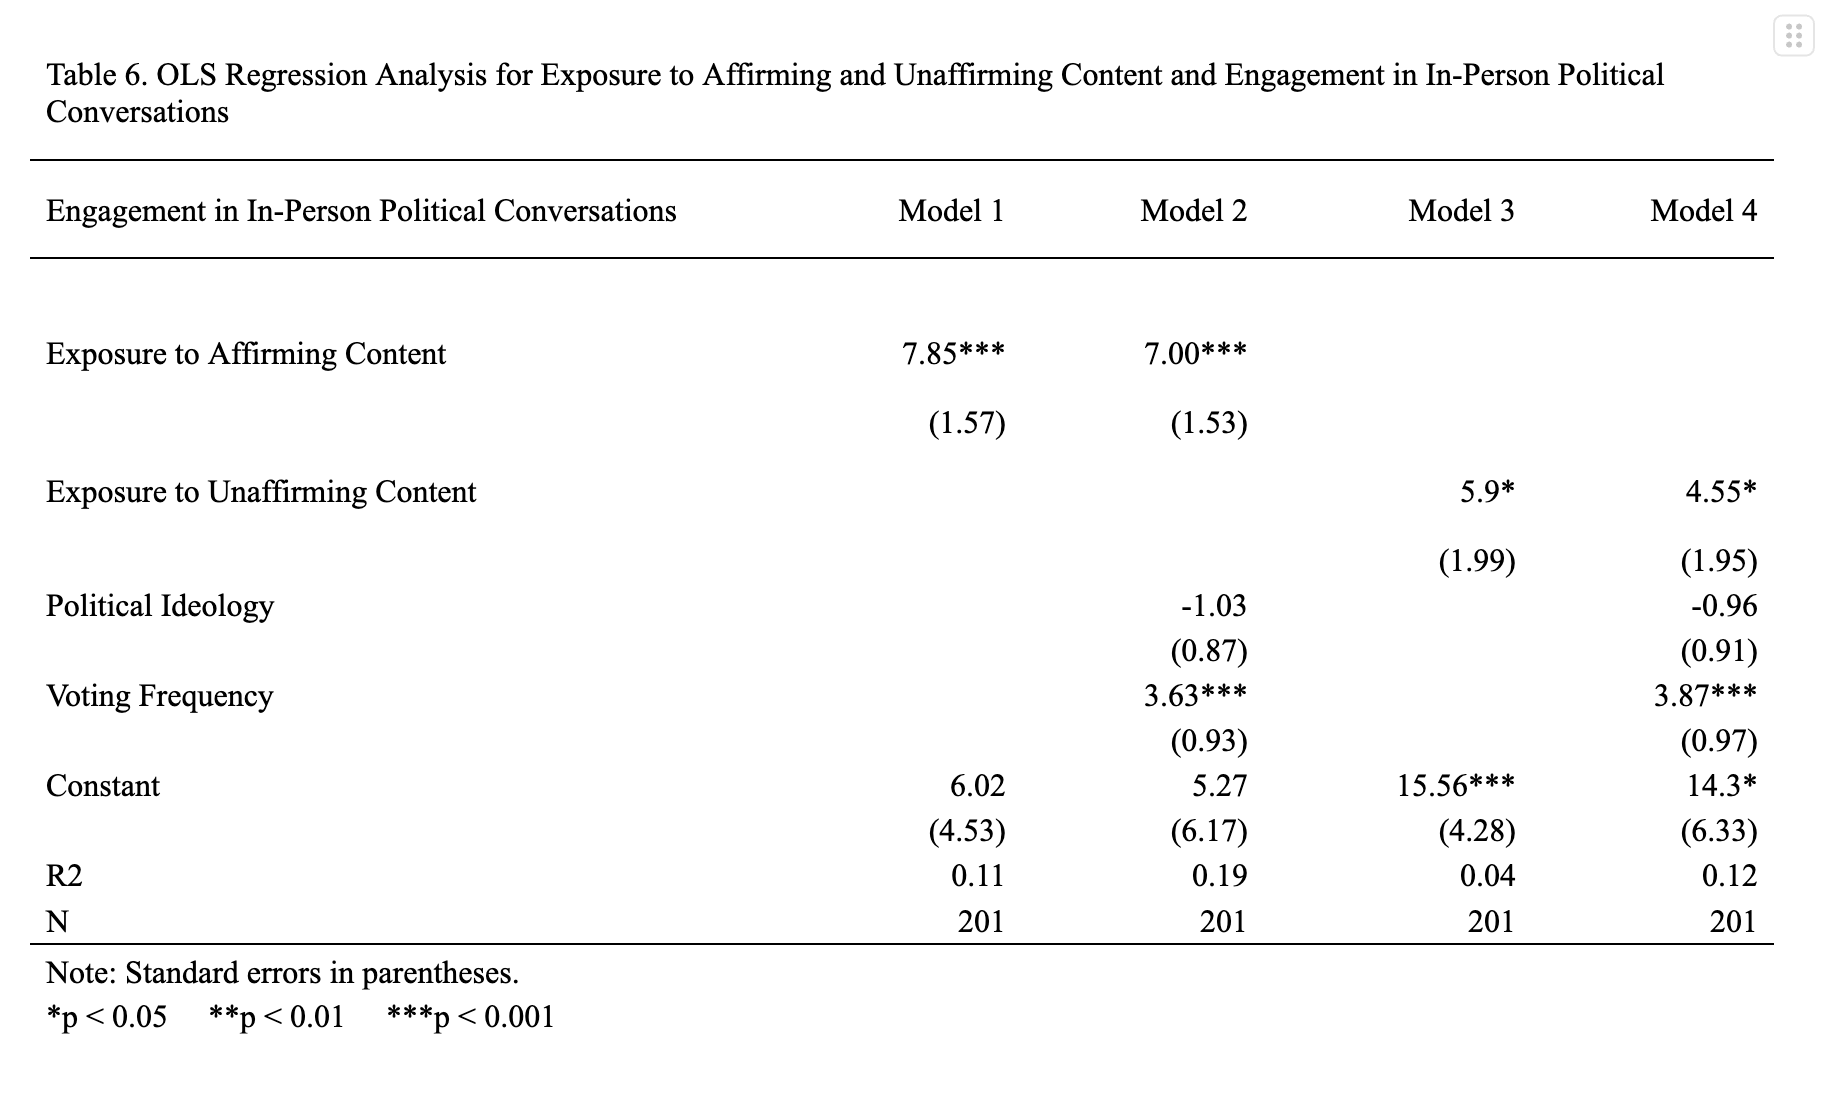
I tested H2 with bivariate and multivariate regressions (Model 3 and Model 4, respectively). In Model 3, the independent variable is exposure to unaffirming content and the dependent variable is engagement in in-person conversations. The coefficient of exposure to unaffirming content is positive and statistically significant (p < 0.05). So, for every 1-point increase on the 0-5 scale that measured exposure to unaffirming content, engagement in an in-person conversation with another Saint Anselm student increases by almost 6 points on the 0-100 scale measuring the dependent variable. This relationship supports H2’s claim that as exposure to unaffirming content increases, users are more likely to have engaged in in-person political conversations. The R2 value explains that about 4% of the variance in engagement in in-person political conversations is explained by exposure to unaffirming content.
Model 4 evaluates the same relationship as Model 3, but controls for political ideology and voting frequency. Since the coefficient of exposure to unaffirming political content remains positive and statistically significant (p < 0.05) when control variables are introduced, the null hypothesis can be rejected. However, the coefficient decreased. With the presence of control variables, for every 1-point increase on the 0-5 scale that measured exposure to unaffirming content, engagement in an in-person conversation with another Saint Anselm student increases by 4.55 points on the 0-100 scale measuring the dependent variable. The coefficient of political ideology is positive, but not statistically significant. The positive and statistically significant coefficient (p < 0.001) of voting frequency shows that the more someone votes, the more likely they are to have engaged in an in-person political conversation with another Saint Anselm student. Therefore, for every 1-point increase in voting frequency, engagement in an in-person political conversation increases by 3.87 points on the 0-100 scale measuring the dependent variable. The positive relationship follows the direction of H2. According to the R2 value, 12% of the variance in engagement in in-person political conversations is explained by the independent variables. H2 is supported by the given data.
Table 7 is a regression table, which I used to test H3. Model 1 is a bivariate regression and Model 2 is a multivariate regression. In Model 1, exposure to affirming content is the independent variable and willingness to engage in in-person conversations with someone who has a similar political ideology is the dependent variable. The coefficient of exposure to affirming content is positive and statistically coefficient (p < 0.001). Therefore, for every 1-point increase on the 0-5 scale measuring exposure to affirming content, a user’s willingness to discuss politics in person with someone who has a similar political ideology increases by 11.2 points on the 0-100 scale measuring the dependent variable.
Further, in Model 2, I controlled for political ideology and voting frequency. The coefficient of exposure to affirming content stayed positive and statistically significant (p < 0.001) but slightly decreased when the control variables were introduced. Now, with the inclusion of these variables, every 1-point increase on the 0-5 scale measuring exposure to affirming content, a user’s willingness to discuss politics in-person with someone who has a similar political ideology increases by 10.52 points on the 0-100 scale measuring the dependent variable. While political ideology’s coefficient is negative and statistically insignificant, voting frequency’s coefficient is positive and statistically significant (p < 0.05). Therefore, for every 1-point increase in voting frequency, willingness to engage in an in-person political conversation with someone who has a similar political ideology increases by 2.99 points on the 0-100 scale measuring the dependent variable.
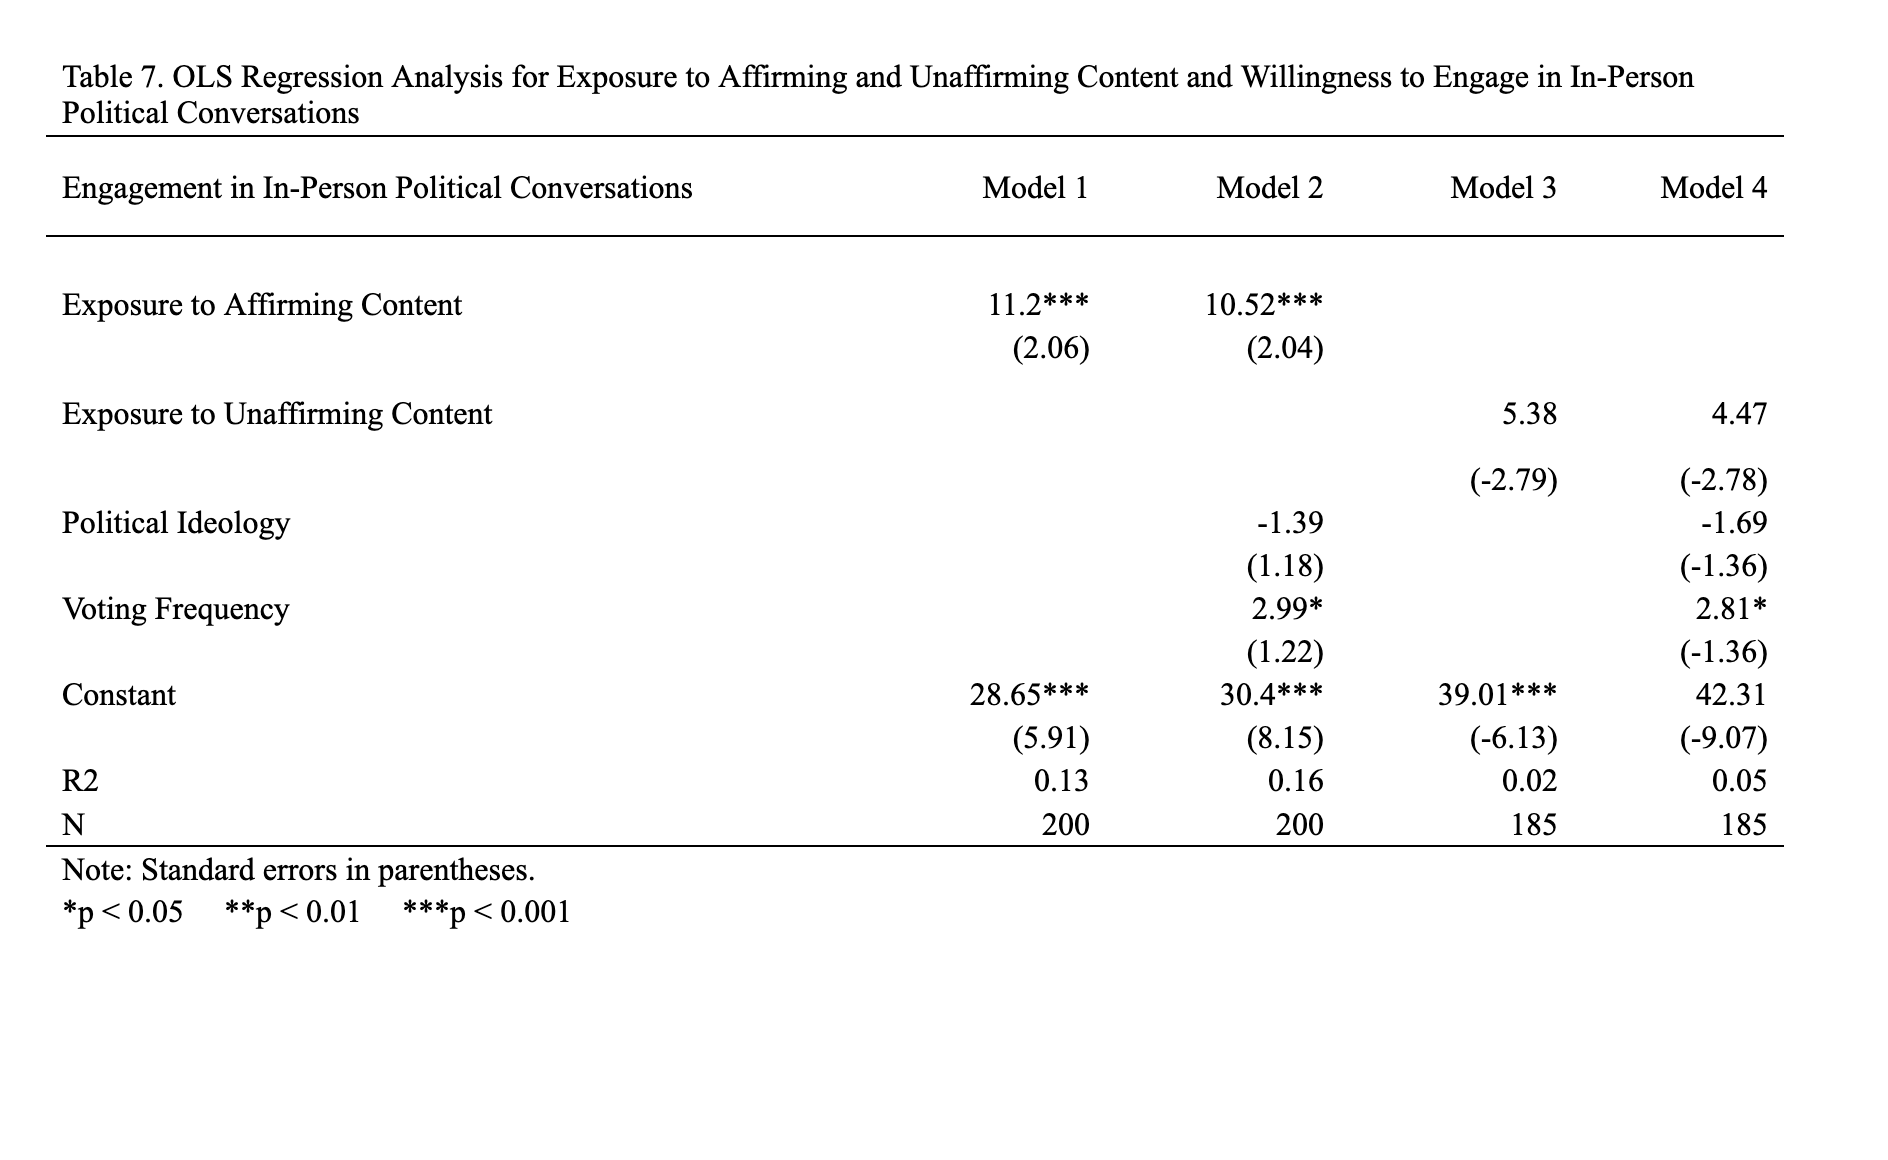
The R2 value increased from Model 1, showing that Model 2 explains 16% of the variance of the dependent variable is explained by exposure to affirming content, political ideology, and voting frequency. Since the coefficient of exposure to affirming content stayed statistically significant and reflects the hypothesized relationship in H3, the null hypothesis can be rejected. Therefore, there is support for H3 with the given data.
Finally, Table 7 also shows data from a bivariate regression (Model 3) and a multivariate regression (Model 4) used to evaluate H4. In Model 3, exposure to unaffirming content is the independent variable and willingness to engage in an in-person political conversation with someone who has a different political ideology is the dependent variable. The coefficient of exposure to unaffirming content is positive and statistically insignificant. The R2 value shows that 2% of the variance in the dependent variable can be explained by the independent variable.
Further, Model 4 controls for political ideology and voting frequency. The coefficient of exposure to unaffirming content remained positive and statistically insignificant when the control variables were introduced. In consistency with all other multivariate regression models, the coefficient of political ideology is negative and statistically insignificant. Similarly, voting frequency’s coefficient is positive and statistically significant (p < 0.05). Therefore, for every 1-point increase in voting frequency, willingness to engage in an in-person political conversation with someone who has a different political ideology increases by 2.81 points on the 0-100 scale measuring the dependent variable. The R2 value slightly increased (5%) but is less relevant considering the statistical insignificance of the independent variable. Due to the insignificant coefficient of the independent variable in both regression models, the null hypothesis cannot be rejected. Thus, there is no support for H4 with the given data.
The survey questions that collected data for H3 and H4 asked respondents to indicate why they answered the way they did. Among these answers, most equated talking about politics with fighting, arguing, or conflict. This may be because many young social media users are exposed to political conflict online, especially if they engage in political discussions (Middaugh, Bowyer, and Kahne 2017, 902). Many young people use social media to stay up to date with news (Barnidge 2017, 312). Perhaps the people that consume news on social media are more apt to be exposed to conflicts about the topic through a comment section or thread. Currently, it is difficult to avoid political conflict on social media. President Trump, members of Congress, and other politicians do not shy away from making political posts on social media that are often harsh or generate heated discussion. Even if a user does not follow political figures on social media, they are bound to see posts or hear discourse discussing posts made by such people. Regardless of exposure to affirming or unaffirming content, polarization is exacerbated as users are more likely to self-censor to avoid a conflict, either in-person or online, with someone with whom they disagree. In other words, there is little room for a less polarized environment when there are few conversations about politics.
The association of political discussions with conflict may also answer my research question in addition to the data I collected. Perhaps the exposure of conflict that stems from exposure to political content surpasses echo chambers. This likely makes users want to self-censor, steering them away from political conversations, which may further an existing polarized communication environment.
Discussion & Conclusion
While only half of my hypotheses were supported by the data, my research contributes to studies in the fields of politics and communication. Existing research does not provide a satisfactory answer to my research question (What is the effect of exposure to political social media content on users’ engagement in political conversations and their willingness to engage?). I assumed that each of my hypotheses served as simple answers to this question, but that was not the case.
Although I found that liberal respondents vote most frequently, are more likely to have engaged in an in-person political conversation than conservatives and are also most willing to engage in political conversations with someone who shares a similar political ideology, there was not a statistically significant relationship between political ideology and the dependent variables in any of the regression models. Therefore, there is no notable association between political ideology and general engagement or willingness to engage in political conversations. However, in each regression model, I found there is a positive and statistically significant relationship between voting frequency and general engagement or willingness to engage in political conversations. This makes sense, as people who vote are politically engaged. Thus, they are bound to have conversations about politics.
Support for H1 is statistically significant, but the positive relationship between exposure to affirming content and in-person engagement in political conversations does not reflect the hypothesis. The data shows as users see more content that affirms their political views, the more likely they are to have engaged in in-person political conversations. Based on research about echo chambers, I assumed the more affirming content someone sees, the less likely they are to want to talk about politics, especially in-person.
H2 is supported with the data in Table 2. The relationships among variables in Models 3 and 4 reflect those in Models 1 and 2. The more exposure to either affirming or unaffirming content a user sees, the more likely they are to have engaged in an in-person political conversation. Based on the coefficients of exposure to affirming and unaffirming content, the more affirming content a user is exposed to, the more likely they are to have engaged in this type of conversation. This contrast is interesting, given my assumption that as exposure to affirming content increases, the likelihood of engagement in in-person political conversations decreases. Political ideology is not a significant predictor of such engagement. The data show that while the exposure of affirming or unaffirming content and voting frequency is significant in predicting engagement in in-person conversations, the coefficients are not high numbers on a 0-100 scale. In other words, there could be another factor in predicting engagement in in-person conversations. Perhaps the physical setting or topic of conversation matters – for which this research does not test. However, the difference between the numbers is notable.
With the given data, H3 is supported and shows that the more affirming content users see, the more likely they are to be willing to engage in an in-person political conversation with someone who has a similar political ideology. This is expected because users who see content that affirms their political views are not necessarily exposed to unaffirming content. Therefore, they would be more willing to talk about politics with someone who shares the same political ideology, since they are not used to hearing disagreeing viewpoints. Many respondents who gave their reasoning for their willingness to engage in this type of conversation said they would be more willing to have an in-person political conversation with someone with a similar political ideology because it is “easier” or “comfortable” to speak with someone with whom they share beliefs. This could indicate and potentially perpetuate affective polarization because users who see a lot of affirming content are in an echo chamber. Since exposure to counter-attitudinal news on social media has been found to decrease affective polarization, it is reasonable to assume that exposure to pro-attitudinal news on social media increases affective polarization (Levy 2021, 832). Therefore, my data shows the more affirming content users are exposed to, they are more willing to discuss politics in-person with someone with a similar ideology, thus perpetuating political polarization. These findings could indicate affective polarization caused by echo chambers, as those who see affirming content likely tend to gravitate toward those who reinforce their political beliefs.
H4 is not supported with the survey data as the positive relationship between exposure to unaffirming content and willingness to engage in an in-person political conversation with someone who has a different political ideology was statistically insignificant. This result could also indicate a polarized environment, as it is possible social media platforms’ algorithms do not allow for much exposure to unaffirming content. The lack of support for H4 is striking, given that social media users who see unaffirming content are exposed to counter-attitudinal views. Therefore, I assumed they would be significantly willing to engage in an in-person political conversation with someone who has a different political ideology, given that they familiar with hearing differing viewpoints. Perhaps I overestimated the effect exposure to unaffirming content has on a user. For example, someone may see unaffirming content and it has no impact on their established political views. More specifically, those with strong political ideology may not be influenced by unaffirming content.
H4’s findings are consistent with scholars that found an attempt to expose social media users to opposing political views may be counterproductive (Bail et al. 2018, 9220). Two respondents gave their reasoning for their willingness to engage in a conversation of this nature. One wrote that they are willing to have political discussions with anyone, as long as they are “civil and intellectual.” The other said that it could lead to arguing, which was a recurring theme throughout respondents’ explanations about their conversational willingness and engagement habits. These responses validate research that has shown people’s differing reasons to have political conversations (Zúñiga et al. 2016, 533). Findings from the data used to evaluate H3 and H4 could suggest a politically polarized environment that already exists and is exacerbated by echo chambers on social media platforms.
Overall, my findings from testing H1 through H3 show that exposure to any political content increases the likelihood of engaging in political conversations but only with those who have a similar political ideology. The positive relationship between the independent and dependent variable in H4 also reflected this finding, but it was not statistically significant. So, regardless of exposure to affirming of unaffirming content, users gravitate towards people like themselves when it comes to having political conversations. These results could also indicate that echo chambers occur in offline contexts because when people only discuss politics with those that have similar political beliefs, their opinions are reinforced. So, they are likely less willing to engage in political conversations with those that have different political ideologies. Respondents’ reasons for having (or not having) various types of political conversations varied.
Most survey respondents’ willingness to engage in a political conversation with someone who has a different political ideology would not change if it were online. Among those who indicated that their answer would change, many said that their reasons for this were because of their digital footprint, the risk of miscommunication/misinterpretation, and the factor of anonymity. Overall, respondents who would be more willing to engage in an in-person political conversation with someone with a different political ideology would do so out of avoidance of publicizing their political views and avoiding conflict, which serves as an example of self-censorship. Notably, there was an overlap in discussion of digital footprints and aggression, likely among those who are more willing to talk about politics in-person.
Many respondents equated talking about politics with conflict when asked about their willingness to have an in-person or online political conversation with someone who shares a similar or political ideology, which answers to my research question. A core principle of democracy is the freedom to have individual beliefs. All people, regardless of their political ideologies, should feel comfortable sharing their beliefs without fear of repercussions. Political conversations shape policy and daily life. Society cannot progress if political conversations are met with hostility or avoided for this reason. Self-censorship because of echo chambers could further instigate a polarized environment, which will endanger democracy.
Altogether, my findings from this study are positive. Evidently, exposure to affirming or unaffirming content does not have as much of an impact on young users’ engagement in political conversations as common wisdom suggests. In other words, the content users see on social media platforms do not hinder them from discussing politics. Rather, the political ideology of the other person involved in the conversation is a deciding factor. If the main problem were to lay with social media, it feels like a more daunting situation to attempt to fix, whereas efforts are already being made to bridge the partisan divide young people are feeling.
The implications of my study are somewhat limited. Since my survey data was collected voluntarily, the sample has low external validity. Therefore, my data is not representative of the population on which I researched. Additional research would benefit from testing these hypotheses on more representative samples. Further research on this topic may benefit from controlling for anonymity, the physical setting of the conversation, the topic of conversation, as well as the gender identity of the other person involved.
Anonymity is a growing feature on social media platforms that could impact users’ discussions about politics and change the implications of having a digital footprint. The physical setting of the conversation could matter in one’s willingness to discuss politics. Perhaps an individual would be more willing to have a political conversation in a dorm room with a roommate or via Snapchat, a platform where messages disappear after a certain amount of time. Contrarily, someone may be less willing to have a political discussion in a public setting, such as at a party. Both the topic and gender identity of the other individual involved in the conversation may also play a role in one’s willingness to discuss politics. For example, a cis-gender person may not be willing to talk about gender affirming healthcare with a transgender person, or a woman may be unwilling to discuss reproductive rights with a man. I also suggest researchers evaluate exposure to political content on different social media applications, as algorithms likely differ from platform to platform. For example, there may be more political content on an application such as Truth Social, X, or Blue Sky than there is on Snapchat.
Further research on this topic is an urgent task considering discussions of young people’s engagement in democratic discourse. The lack of support for some of my hypotheses, which seem generally understood to be common sense, proved the importance of testing what is believed to be true. I caution those who research this topic to stay vigilant in not blindly believing what seem to be reasonable claims.
Bibliography
Astleitner, Hermann, and Sarah Schlick. 2025. “The Social Media Use of College Students: Exploring Identity Development, Learning Support, and Parallel Use.” Active Learning in Higher Education 26 (1): 240.
Bail, Christopher A., Lisa P. Argyle, Taylor W. Brown, John P. Bumpus, Haohan Chen, M.B. Fallin Hunzaker, Jaemin Lee, Marcus Mann, Friedolin Merhout, and Alexander Volfovsky. 2018. “Exposure to Opposing Views on Social Media Can Increase Political Polarization.” The Proceedings of the National Academy of Sciences 115 (37): 9220.
Barnidge, Matthew. 2017. “Exposure to Political Disagreement in Social Media Versus Face-to-Face and Anonymous Online Settings.” Political Communication 34 (2): 302-21.
Cho, Jaeho, Saifuddin Ahmed, Martin Hilbert, Billy Liu, and Jonathan Luu. 2020. “Do Search Algorithms Endanger Democracy? An Experimental Investigation of Algorithm Effects on Political Polarization.” Journal of Broadcasting & Electronic Media 64 (2): 150-72.
Cinelli, Matteo, Gianmarco De Francisci Moralesb, Alessandro Galeazzic, Walter Quattrociocchi, and Michele Starninib. 2021. “The Echo Chamber Effect on Social Media.” PNAS 118 (9): 1-8.
“Digital 2024: The United States of America.” 2024. DataReportal – Global Digital Insights. February 22, 2024. https://datareportal.com/reports/digital-2024-united-states-of-america.
Hampton, Keith N., Inyoung Shin, and Weixu Lu. 2017. “Social Media and Political Discussion: When Online Presence Silences Offline Conversation.” Information, Communication & Society 20 (7): 1090-1107.
Hayes, Andrew. F., Carroll J. Glynn, and James Shanahan. 2005. “Validating the Willingness to Self-Censor Scale: Individual Differences in the Effect of the Climate of Opinion on Opinion Expression.” International Journal of Public Opinion Research 17 (4): 443.
Hayes, Andrew F., Dietram A. Scheufele, and Michael E. Huge. 2006. “Nonparticipation as Self-Censorship: Publicly Observable Political Activity in a Polarized Opinion Climate.” Political Behavior 28 (3): 263-264.
Jeong, Min Seon, Jacob A. Long, and Simon M. Lavis. 2023. “The Viral Water Cooler: Talking About Political Satire Promotes Further Political Discussion.” Mass Communication and Society 26 (6): 938-62.
Kitchens, Brent, Steven L. Johnson, and Peter Gray. 2020. “Understanding Echo Chambers and Filter Bubbles: The Impact of Social Media on Diversification and Partisan Shifts in News Consumption.” MIS Quarterly 44 (4): 1619.
Kruse, Lisa M., Dawn R. Norris, and Jonathan R. Flinchum. 2018. “Social Media as a Public Sphere? Politics on Social Media.” The Sociological Quarterly 59 (1): 62-84.
Kubin, Emily, and Christian von Sikorski. 2021. “The Role of (Social) Media in Political Polarization: A Systematic Review.” Annals of the International Communication Association 45 (3): 188-206.
Kwak, Nojin, Daniel S. Lane, Brian E. Weeks, Dam Hee Kim, and Slgi S. Lee. 2022. “Now We’re Talking? Understanding the Interplay Between Online Selective and Incidental Exposure and Their Influence on Online Cross-Cutting Political Discussion.” Social Science Computer Review 40 (3): 579-97.
Levy, Ro’ee. 2021. “Social Media, News Consumption, and Polarization: Evidence from a Field Experiment.” American Economic Review 111 (3): 831-70.
Lorenzano, Kyle John, Miles Sari, Colin Harrell Storm, Samuel Rhodes, and Porismita Borah. 2018. “Challenges for an SNS-Based Public Sphere in 2016.” Online Information Review 42 (7): 9.
Middaugh, Ellen, Benjamin Bowyer, and Joseph Kahne. 2017. “U Suk! Participatory Media and Youth Experiences With Political Discourse.” Youth & Society 49 (7): 902.
Nadeem, Reem. 2024. “1. The Partisanship and Ideology of American Voters.” Pew Research Center (blog). Accessed April 10, 2025. https://www.pewresearch.org/politics/2024/04/09/the-partisanship-and-ideology-of-american-voters/.
Persily, Nathaniel, and Joshua A. Tucker, eds. 2020. Social Media and Democracy: The State of the Field, Prospects for Reform. 1st ed. Cambridge University Press.
Platt, Carrie Anne, Don Waisanen, and José Marichal. 2024. “Why Do Some Shout and Others Stay Silent? Communication Context Consistency in Political Discourse Offline and on Facebook.” International Journal of Communication (18) 2272-94.
Ponder, J. D., and Paul Haridakis. 2015. “Selectively Social Politics: The Differing Roles of Media Use on Political Discussion.” Mass Communication and Society 18 (3): 281-302.
Powers, Elia, Michael Koliska, and Pallavi Guha. 2019.“‘Shouting Matches and Echo Chambers’: Perceived Identity Threats and Political Self-Censorship on Social Media.” International Journal of Communication 13: 3644.
Sharma, Megha. 2024. “Understanding Social Media Algorithms [2024 Complete Guide].” SocialPilot. Accessed March 13, 2025. https://www.socialpilot.co/blog/social-media-algorithm.
Smith, Carl. 2023. “How Much Could Younger Voters Affect Future Election Outcomes?” Governing. Accessed March 13, 2025. Governing. https://www.governing.com/now/how-much-could-younger-voters-affect-future-election-outcomes.
Sürmelioğlu, Yeşim, and Süleyman Sadi Seferoğlu. 2019. “An Examination of Digital Footprint Awareness and Digital Experiences of Higher Education Students.” World Journal on Educational Technology: Current Issues 11, (1): 48.
Swart, Joëlle. 2021.“Experiencing Algorithms: How Young People Understand, Feel About, and Engage With Algorithmic News Selection on Social Media.” Social Media + Society 7 (2): 1-11.
Van Bavel, Jay J., Steve Rathje, Elizabeth Harris, Claire Robertson, and Anni Sternisko. 2021. “How Social Media Shapes Polarization.” Trends in Cognitive Sciences 25 (11): 913-16.
Yamamoto, Masahiro, Matthew J. Kushin, and Francis Dalisay. 2015. “Social Media and Mobiles as Political Mobilization Forces for Young Adults: Examining the Moderating Role of Online Political Expression in Political Participation.” New Media & Society 17 (6): 881.
Yarchi, Moran, Christian Baden, and Neta Kligler-Vilenchik. 2021. “Political Polarization on the Digital Sphere: A Cross-Platform, Over-Time Analysis of Interactional, Positional, and Affective Polarization on Social Media.” Political Communication 38 (1): 99.
Zúñiga, Homero, Sebastián Valenzuela, and Brian E. Weeks. 2016. “Motivations for Political Discussion: Antecedents and Consequences on Civic Engagement.” Human Communication Research 42 (4): 533.
Appendix A. Survey Questions
The following will be displayed on a page prior to the first question of the survey:
Hi there! My name is Lauren Blois, and I am a senior Politics major. I am currently working on
my senior thesis project called “Let’s Talk Politics: Exposure to Political Social Media Content,”
which seeks to find a potential relationship between social media and conversations about
politics and am therefore surveying a number of current Saint Anselm College students.
The survey consists of 19 questions which take about 10 minutes to complete.
The survey is completely voluntary and anonymous and no identifying information about you will be collected.
You can exit the survey at any time or skip any questions that you are uncomfortable answering. Your survey response benefits my research, as well as the greater understanding of political polarization that may stem from social media use and involves minimal risks though I do ask questions about political identity.
In the event of any publication or presentation resulting from the research, no personally
identifiable information will be shared. The anonymous data from this survey will be stored on
my computer, and will be retained until January 1, 2026.
You have the right to ask any questions you may have about this research. If you have any
questions or concerns about this survey, you can contact me (lblois149@anselm.edu), my
professor (ecleven@anselm.edu), or the Saint Anselm College Institutional Review Board (irb@anselm.edu).
By clicking “next,” you are giving your consent to participate in my research. Thank you!
Question 1) Are you at least 18 years old? (AGE)
Yes
No
Question 2) Do you use social media? (SMUSE)
Yes
No
Question 3) On a scale of 1-7, with 1 being the most liberal and 7 being the most conservative, how would you generally describe your political ideology? (IDEOL)
Very Liberal
Somewhat Liberal
Lean Liberal
Independent
Lean Conservative
Somewhat Conservative
Very Conservative
Question 4) What is your political party identification? (POLID_1)
Republican
Democrat
Independent / Undeclared
Something Else
Question 4a)(If independent / undeclared or something else…)
Which political party do you tend to lean towards? (POLID_2)
The Republican Party
The Democratic Party
Question 5) How often do you vote in an election? (VFREQ)
0. I haven’t been old enough to vote in an election
Never
Rarely
When it is convenient
Sometimes
Every time I am able to vote
Question 6) Select all the types of elections in which you have voted. (VTYPE)
None
Town / City
State
Presidential
The term “social media,” is defined as means of electronic communication through which users foster online communities to share content with an audience. For example, Snapchat, Instagram, TikTok, and YikYak, are all examples of social media.
Question 7) Which of the following social media platforms do you use on a regular basis? Choose all that apply. (SMPLAT)
Snapchat
Instagram
TikTok
Facebook
YikYak
X (formerly known as Twitter)
Other:
Question 8) On average, how many hours would you estimate you spend on social media per day? (SMTIME)
0. Less than 1 hour
1-2 hours
2-3 hours
3-4 hours
4-5 hours
5-6 hours
6-7 hours
More than 7 hours
The term “political content on social media” is defined as any posts on social media that relate to a political figure (ex. current or former elected officials) as well as posts regarding a political topic in a manner of expression or debate (ex. elections, abortion, climate change, etc.). Additionally, political social media content can be defined as comments under such posts about a political figure or issue as previously exemplified.
Question 9) Based on these definitions, on a scale of 0-100 where 0 is no political content and 100 is all political content, how much of your social media feed is made up of political content? (POLCONT)
*0-100 scale*
“Content that affirms political views” is defined as political social media content that supports a user’s view of a political figure or issue. For example, this content may act in a negative manner towards the user’s opposing political party or positively towards their view on a political topic.
Question 10) On a scale of 0-5, (0 is seeing no political content on your feed) where 1 is seeing very little affirming content on your feed and 5 is seeing only affirmative content on your social media feed, where do you fall? (AFFCONT)
0. I do not see any political content on my social media feed
I see very little affirming content on my social media feed
I see some affirming content on my social media feed
About half of the content on my social media feed is affirming
I see mostly affirming content on my social media feed
I see only affirming content on my social media feed
Content that does not affirm political views, or “un-affirmative content” is defined as political social media content that does not support a user’s view of a political figure or issue. For example, this content may act in a positive manner towards the user’s opposing political party or positively towards their view on a political topic.
Question 11) On a scale of 0-5, (0 is seeing no political content on your feed) where 1 is seeing very little un-affirming content on your feed and 5 is seeing only un-affirmative content on your social media feed, where do you fall? (UNAFFCONT)
0. I do not see any political content on my social media feed
I see very little un-affirming content on my social media feed
I see some un-affirming content on my social media feed
About half of the content on my social media feed is un-affirming
I see mostly un-affirming content on my social media feed
I see only un-affirming content on my social media feed
“Engaging in political conversation” is defined as actively participating in discussion that relates to a political figure (ex. current or former elected officials) and/or a political topic in a manner of view, expression, or debate (ex. elections, abortion, climate change, etc.).
An “in-person political conversation” is defined as actively participating in face-to-face discussion that relates to a political figure (ex. current or former elected officials) and/or a political topic in a manner of view, expression, or debate (ex. elections, abortion, climate change, etc.).
Question 12) On a scale of 0-100, where 0 is never and 100 is all the time, generally, how often do you engage in an in-person political conversation with another Saint Anselm student? (ENGE_IP)
*0-100 scale*
An “online political conversation” is defined asactively participating in written discussion (posting comments on a social media post, text, email, etc.) that relates to a political figure (ex. current or former elected officials) and/or a political topic in a manner of view, expression, or debate (ex. elections, abortion, climate change, etc.).
Question 13) On a scale of 0-100, where 0 is never and 100 is all the time, generally, how often do you engage in an online political conversation with another Saint Anselm student? (ENGE_O)
*0-100 scale*
Question 14)On a scale of 0-100, where 0 is not at all willing and 100 is absolutely willing, how willing are you to have an in-person political conversation with another Saint Anselm student with whom you share a similar political identity? (IP_SPI_1)
*0-100 scale*
Question 15) Without giving identifiable information about yourself or others, why did you choose the answer for the question above? (IP_SPI_2)
*open response*
Question 16) On a scale of 0-100, where 0 is not at all willing and 100 is absolutely willing, how willing are you to have an in-person political conversation with another Saint Anselm student with whom you share a different political identity? (IP_DPI_1)
*0-100 scale*
Question 17) Without giving identifiable information about yourself or others, why did you choose the answer for the question above? (IP_DPI_2)
*open response*
Question 18) Would your answer to the previous question change if the conversation was online? (CHNG_1)
Yes
No
Maybe
I’m not sure
Question 19) Without giving identifiable information about yourself or others, why did you choose the answer for the question above? (CHNG_2)
*open response*